
Every Hotel Booking Needs Its Own P&L



The first time I tried to reconstruct the profitability of a specific stay, the booking seemed straightforward. Three nights, a healthy rate, breakfast included and a small amount of restaurant spend. The commercial report classified it as good business, and the ADR supported that impression. However, once I added the commission, payment processing cost, two prior modifications, additional housekeeping, the breakfast actually consumed and compensation granted at check-out, the margin narrowed far more than expected. The rate was not wrong. What was incomplete was the way we looked at the booking.
In Hospitality, we live with an abundance of aggregated indicators and a striking lack of economic explanations at stay level. We know how much the hotel generated, what occupancy it achieved, how RevPAR evolved and whether the department ended within budget. Yet when someone asks how much money a specific booking contributed, the answer usually turns into a tour through several reports, three departments and a spreadsheet whose author is conveniently on holiday. That difficulty is not administrative; it reveals that the commercial unit we accept every day still does not match the economic unit we analyse.
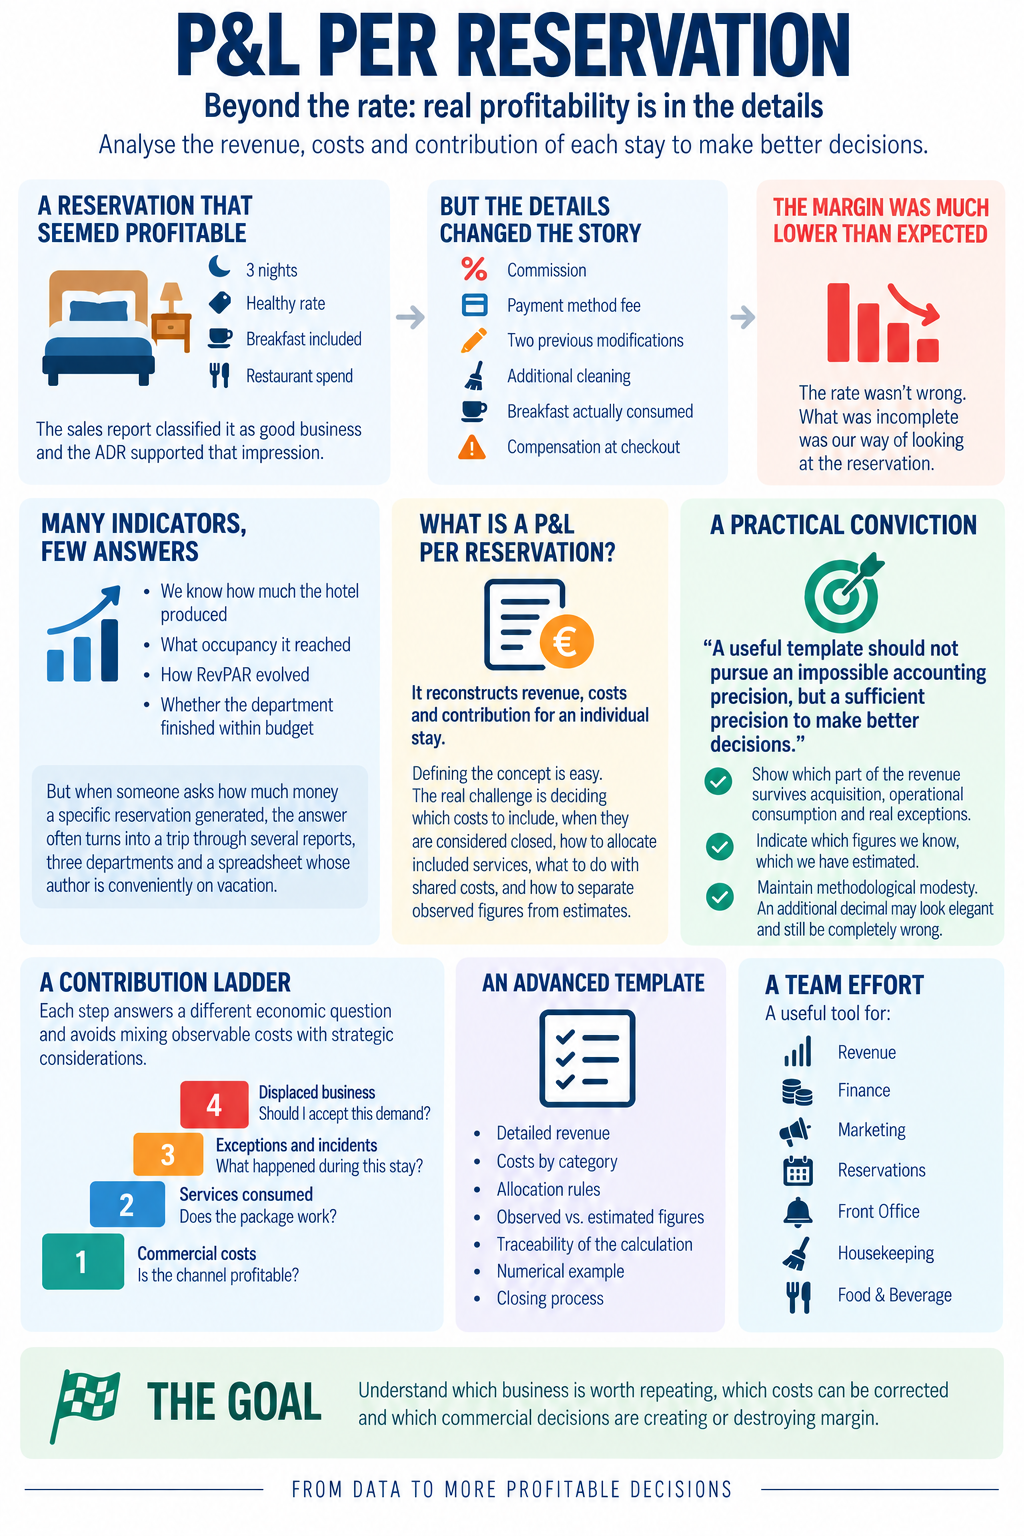
A Stay P&L bridges part of that gap by reconstructing revenue, costs and contribution for an individual stay. But defining the concept is far easier than implementing it. The real difficulty begins when deciding which costs should be included, when they are considered final, how to allocate included services, what to do with shared expenses and how to distinguish an observed figure from an estimate. If everything is allocated, the booking ends up carrying half the hotel. If we deduct only the commission and a standard room cost, we obtain a comfortable, though probably fictional, profitability figure.
Over the years, I have reached a practical conviction: a useful template should not pursue impossible accounting precision, but rather enough precision to make better decisions. Its purpose is to show what portion of revenue survives acquisition, operating consumption and the stay’s actual exceptions. It should also indicate which figures we know, which we have estimated and which items remain outside the calculation. Methodological humility matters. An additional decimal place may look very elegant and still be completely wrong.
The framework I set out below turns the booking P&L into a working tool for Revenue, Finance, Marketing, Reservations, Front Office, Housekeeping and Food & Beverage. It includes a layered contribution architecture, an advanced template, allocation rules, a numerical example and a closing process. Its purpose is not to produce another table for the monthly meeting, but to help you understand which business is worth repeating, which costs can be corrected and which commercial decisions are creating margin or destroying it.
Net contribution requires layers, rules and boundaries
The most common mistake when building a profit and loss account by booking is to look for a single definitive figure too soon. Revenue is added, costs are deducted and a net contribution appears to answer every question. The problem is that each decision requires a different level of depth. To compare channels, I can work with commercial costs; to review a package, I need to include the services consumed; to analyse a problematic stay, I must add compensation and incidents; and to decide whether to accept demand on a critical date, I also need to consider displaced business.

Your hotel already generates the data. HotelGEX turns it into decisions.
A platform built from real hotel operations to connect guests, Customer Journey, operations, Revenue, F&B, Groups & Events and Management within one intelligent context.
That is why I prefer to build a contribution ladder. Each rung answers a different economic question and prevents observable costs from being mixed with strategic valuations. The template therefore retains calculation traceability and allows two professionals to debate a specific assumption without having to challenge the entire account.
The four levels I use to read a stay
- Commercial contribution, or NC1. This measures how much revenue remains after the costs required to acquire, confirm and collect the booking. It includes commissions, attributable advertising investment, transaction costs, hotel-funded benefits, Reservations support and costs caused by modifications or cancellations. It is particularly useful for comparing channels, campaigns, rates and segments without charging distribution with costs that belong to service delivery.
- Operating contribution, or NC2. This deducts from NC1 the variable consumption generated by the stay. This is where cleaning, laundry, amenities, incremental energy consumption, included food and beverage, variable costs of ancillary services and identifiable additional work appear. This layer reveals whether the product sold retains margin once it has been delivered.
- Realised contribution, or NC3. This incorporates compensation, refunds, incidents, chargebacks, damages absorbed by the hotel and other exceptional costs linked to the stay. It is the figure closest to the economic margin the booking actually generated after check-out, although it still does not equal the hotel’s full accounting profit.
- Decision-adjusted contribution, or NC4. This adds valuations that are not always accounted for, such as demand displacement, pressure on critical capacity, expected risk or reasonably evidenced relationship value. I do not use it to record a financial result, but to decide whether a type of business should be accepted, repeated, restricted or redesigned.
This separation prevents opportunity cost from contaminating the reading of a stay that has already taken place. If a booking generated €500 in NC3, that contribution existed. It is another matter whether, on a high-demand date, it may have displaced a booking capable of contributing €650. The first figure describes what happened; the second helps assess the decision. Confusing the two leads to endless discussions between Finance and Revenue in which, interestingly, everyone may be partly right.
It is also worth linking this retrospective view to future inventory allocation. On restricted dates, the question is no longer only how much margin a stay generated, but whether that contribution justified taking capacity off the market. It is the same logic I develop when analysing why hotel inventory must earn its place booking by booking, although the focus here is on closing the realised economics and learning from them.
Three ledgers to avoid mixing facts with assumptions
Within each level, I distinguish three types of data. This classification may seem like a minor methodological safeguard, but it completely changes the confidence we can place in the result.
- Recorded amounts. These come from identifiable financial transactions, such as net accommodation revenue, a settled commission, an amount posted to the folio, a refund or compensation. They are the most robust data, although they require reconciliation because appearing in a system does not guarantee they have been correctly attributed.
- Allocated amounts. These are real costs that must be distributed through a rule, such as Reservations work, cleaning cost, laundry or a campaign that generated several conversions. The total figure exists, but its allocation across bookings depends on a declared criterion.
- Estimated amounts. These represent consumption, risks or opportunity costs that cannot yet be directly observed. They should carry an assumption, a review date and a confidence level. Presenting them as facts merely makes the template look more precise than it is.
I recommend that each line include a data type field, marked R for recorded, A for allocated and E for estimated. I would also add the update date and the owner of the rule. When the standard cost of cleaning a room changes, it should be possible to know which bookings were calculated using the previous value and which using the new one. Without that control, changes in margin may reflect methodology changes rather than real changes in the business.
What should be included and what should remain outside
An individual P&L works best with a logic of incremental cost and reasonable causality. An item should be included when the booking causes, consumes or increases it in an identifiable way. The full salary of the Front Office team does not disappear if a specific booking fails to arrive; the overtime spent resolving five complex modifications, however, can be related to it.
I apply four tests before allocating a cost:
- Causality test. I ask whether the cost would have existed, or would have been of a similar scale, without that stay. If the answer is yes, we are probably dealing with a fixed or shared cost that should not be charged directly.
- Variability test. I check whether the cost changes with the number of nights, occupants, services consumed, cleans, transactions or incidents. The unit of consumption should reflect the real driver rather than being conveniently limited to room count.
- Traceability test. I verify whether a source or reproducible rule exists. I do not need an individual invoice for every amenity, but I do need a defensible standard based on consumption and replenishment.
- Usefulness test. I assess whether having the figure could change a decision. Spending hours measuring a negligible item may create an analytical cost greater than the knowledge gained.
Fixed costs of structure, property, general administration, insurance or depreciation remain essential for understanding the overall result, but introducing them through an arbitrary allocation can distort comparisons between bookings. I prefer to stop the template at the controllable contribution per stay and then reconcile its total with the hotel’s profit and loss account. The Booking P&L does not replace financial accounting; it opens a different economic view.
The right unit of consumption is rarely just one
A booking has nights, rooms, guests, transactions, services, requests and occupied hours. Using only room nights as the divisor simplifies the model, but it can penalise simple stays and subsidise complex ones. A room occupied by one person for three nights does not consume the same resources as another used by four guests, with a sofa bed, breakfast, additional cleans and several staggered arrivals.
In the template, I assign each cost its primary driver:
- Per occupied room. Inspection, departure cleaning, part of the amenities and certain basic consumption.
- Per night. Incremental energy, pet stays where applicable, maintenance cleaning and certain recurring services.
- Per guest or user. Breakfast, welcome amenities, included consumption, children’s materials and other personal services. It is worth remembering that the human unit of a stay does not always match the person who made the booking, as I explain when addressing the economic and experiential role of accompanying guests.
- Per transaction. Payment processing cost, fraud, currency conversion or certain commissions.
- Per operational event. Modification, room move, exceptional delivery, service recovery or additional cleaning.
- Per minute or hour of capacity. Late check-outs, early arrivals, additional preparation time and the occupation of scarce resources. In these cases, it is useful to apply the logic that every room hour commits capacity and margin.
This variety can feel intimidating at first. My advice is to begin with five or six cost drivers and expand only when the decision justifies it. An advanced template is not the one with the most columns, but the one that best explains the relevant differences between stays.
The template that turns a stay into an economic decision
The structure I propose can be implemented in a spreadsheet, an analytical database or a more sophisticated financial environment. The tool matters less than internal agreement on definitions, rules and responsibilities. If Commercial understands net revenue to mean one thing, Finance another and Operations a third, automation will not solve the problem. We will simply obtain discrepancies faster.
Booking identity and context block
Before calculating margin, the template must identify the booking in a way that allows it to be grouped and compared without unnecessarily exposing personal information. I do not need to turn the P&L into another detailed guest profile. I need to understand the economics of the stay.
- Operational identifiers. Anonymised booking number, folio, creation date, arrival, departure, nights, rooms and occupancy.
- Commercial source. Channel, subchannel, campaign, source market, segment, company or agency where applicable, and device or point of sale where relevant.
- Product purchased. Booked category, occupied category, board basis, package, rate code, cancellation policy, supplements and included benefits.
- Demand context. Lead time, forecast occupancy when booked, final occupancy, compression level on the dates and applicable restrictions.
- Stay complexity. Number of modifications, requests, connecting rooms, room allocation changes, incidents and booked services.
- Economic status. Expected, provisional or closed P&L, together with the date of the latest close and the percentage of estimated items.
The occupied-category field is important because an upgrade can alter operational consumption and opportunity cost. It is not advisable to charge the booking the full selling value of a higher category if the upgrade did not displace business, but neither should we pretend that using that inventory was always free. The template should preserve the fact and allow it to be valued according to context.
Net stay revenue block
Revenue should be recorded excluding indirect taxes and without duplication between packages, accommodation and included services. A practical structure separates:
- Accommodation revenue. Room rate after discounts, credits, refunds and adjustments directly related to price.
- Ancillary revenue. Food and beverage, spa, parking, transfers, activities, minibar, laundry, rentals, upgrades, early check-in, late check-out and any other purchased service.
- Allocated included services. The economic share attributed to breakfast, dinner, treatments or other package components. This should be an internal reclassification and never revenue added a second time.
- Post-stay revenue. Legitimate charges processed after departure, final adjustments and recoveries linked to the stay.
The starting formula is simple:
Net stay revenue = net accommodation + net ancillary revenue + post-stay adjustments − commercial refunds
The challenge arises with packages. If a €300 rate includes room and breakfast, I cannot record €300 as accommodation and then add the value of breakfast. I must allocate those €300 across components using a consistent rule. That allocation makes it possible to compare products and calculate the margin of each service without creating revenue.
Commercial and payment collection costs block
Here I record the cost required to convert demand into a booking and revenue into available cash. I include:
- Distributor commission and margin. Settled amounts should be used when available, including taxes on commission where these are a cost to the hotel.
- Attributable acquisition investment. Advertising, metasearch, affiliate activity, remarketing or specific campaigns. It is advisable to separate direct conversion cost from expenditure aimed at brand building or future demand, for which individual attribution is generally more debatable.
- Payment method cost. Percentage commission, fixed fee, currency conversion, financing and realised fraud or chargeback.
- Reservations and pre-stay service cost. Time or standard cost for calls, emails, quotes and modifications when they exceed the routine service defined by the hotel.
- Funded commercial benefits. Credits, points, member discounts, promotional amenities or benefits whose cost is borne by the property.
- Cancellation and resale cost. Only where it can be linked to the booking or its commercial policy. A cancelled booking can also have a P&L, even if it never becomes a stay.
Using these items, I calculate:
NC1 = net stay revenue − acquisition costs − payment collection costs − commercial benefits − attributable pre-stay costs
This layer makes it clear that two direct bookings are not necessarily equivalent either. One may come through an existing relationship, while another requires advertising, an incentive, telephone support and a discount. The “direct” label describes the entry point, but does not by itself guarantee a better contribution.
Operational consumption block
The second layer translates the stay sold into resources consumed. To avoid an unmanageable model, I group costs into families with clear drivers:
- Room and housekeeping. Arrival or departure cleaning, in-stay servicing, laundry, amenities, replenishment, extra bed, consumables and incremental energy.
- Included services. Ingredients, consumables, external commissions and incremental labour cost for breakfast, half board, spa, included activities or transfers.
- Ancillary consumption. Variable cost of additional services sold. Additional revenue should not be celebrated without checking whether operations could deliver it while preserving margin. This discipline connects with the need to authorise cross-selling according to capacity and contribution.
- Attributable operational complexity. Room moves, special setups, repeated deliveries, exceptional service and additional coordination caused by the configuration of the stay.
- External costs per stay. Experience providers, transport, guides, tickets, local commissions and other services purchased to fulfil the product sold.
The second-layer formula is:
NC2 = NC1 − variable room cost − cost of included services − variable cost of additional services − attributable operational complexity
I do not recommend measuring every conversation or turning hospitality into a permanent stopwatch. I do consider it reasonable to create standard units for events that repeatedly consume capacity. A room move has an average cost; a cot requires preparation, delivery and removal; a complex dietary request may alter purchasing and production. The aim is not to penalise the guest, but to design more honest products, processes and prices.
Exceptions and service recovery block
NC3 incorporates the part that often disappears from commercial analyses: the cost of what went wrong. A booking may retain its rate in the report while having required compensation, a complimentary dinner, alternative transport, overtime or a subsequent refund.
I record separately:
- Monetary compensation. Discount, refund or removal of charges.
- In-kind compensation. The real variable cost of the service offered, not its menu price.
- Operational recovery. Transport, urgent repair, exceptional cleaning, additional room or external provider.
- Fraud, non-payment and disputes. Realised loss and identifiable administrative costs.
- Attributable damage. Only where responsibility and amount can be supported by objective criteria.
The formula then becomes:
NC3 = NC2 − compensation − operational recovery − realised fraud − other exceptional costs
It is advisable to add a cause code. Compensation does not only reduce margin; it also provides information for correcting maintenance, the commercial promise, allocation, cleaning, coordination or policy. If the P&L merely shows that a stay was unprofitable without explaining why, we risk blaming the segment or channel for a failure caused by us.
Strategic block for capacity, risk and relationship
The final layer should be handled cautiously because it incorporates less observable values. I would keep it separate from the realised result and include three possible adjustments:
- Demand displacement. The difference between the contribution of the booking accepted and the expected contribution of the best rejected or unavailable demand. It only makes sense on dates with genuine restriction and sufficient evidence.
- Pressure on critical capacity. Estimated cost of using a scarce resource such as specific rooms, housekeeping slots, tables, treatment rooms, parking or late check-outs. This reading should be based on a realistic understanding of how much capacity the hotel can sell without degrading operations.
- Validated relationship value. Expected future contribution based on repeat business, a corporate relationship or demonstrated recommendation potential. A generic promise of loyalty should never be used to justify a structurally loss-making booking.
I propose calculating adjusted contribution as follows:
NC4 = NC3 − estimated displacement − critical capacity cost − residual risk + validated relationship value
NC4 should not be presented without showing the adjustments that comprise it. Two optimistic assumptions can turn a mediocre stay into a magnificent investment on screen. The template needs to retain the observed result and prevent commercial enthusiasm from retrospectively rewriting the economics.
An advanced template ready to adapt
| Block | Main field | Driver | Type | Close-out point |
|---|---|---|---|---|
| Identity | Channel, segment, rate, dates and occupancy | Booking | Recorded | Confirmation and check-out |
| Revenue | Accommodation and net services | Folio transaction | Recorded | Check-out |
| Acquisition | Commission and acquisition | Channel or campaign | Recorded or allocated | Settlement |
| Collection | Fees, currency and fraud | Transaction | Recorded | Bank settlement |
| Reservations | Service and modifications | Service event | Allocated | Check-in |
| Room | Housekeeping, linen, amenities and energy | Night, occupant or service | Allocated | Check-out |
| Included services | Breakfast, spa, transfer or activity | Actual consumption | Recorded or allocated | Check-out |
| Extras | Variable cost of additional services | Unit sold | Recorded or allocated | Check-out |
| Exceptions | Compensation and incidents | Event | Recorded | Incident close-out |
| Capacity | Displacement and operational pressure | Date or critical resource | Estimated | Subsequent review |
| Relationship | Validated future value | Guest or account | Estimated | Periodic review |
To each field, I would add currency, amount, calculation rule, internal source, date, owner, confidence level and observations. I would also retain the version of the rule applied. If the standard cleaning cost was €16 in January and rose to €19 in July, the historical record should retain the corresponding methodology or be explicitly recalculated.
Example of a stay that looked better than it was
Let us imagine a three-night booking with €720 in net accommodation revenue and €180 in ancillary spend. Total net revenue amounts to €900. From there, we reconstruct contribution:
| Concept | Amount | Cumulative result |
|---|---|---|
| Net stay revenue | €900 | €900 |
| Channel commission | −€108 | €792 |
| Payment collection cost | −€18 | €774 |
| Attributed acquisition | −€24 | €750 |
| Service and modifications | −€14 | €736 NC1 |
| Room, housekeeping and consumption | −€87 | €649 |
| Included services | −€42 | €607 |
| Variable cost of extras | −€48 | €559 NC2 |
| Final compensation | −€25 | €534 NC3 |
| Estimated displacement | −€90 | €444 |
| Pressure on critical capacity | −€20 | €424 NC4 |
The booking generated €534 in realised contribution and €424 after strategic adjustments. Both figures are useful, but they do not say the same thing. NC3 allows us to compare what was delivered; NC4 helps review whether acceptance was the best decision available on those dates. If we mixed both levels, we might wrongly conclude that the operation destroyed €110, when in reality that amount represents an estimated opportunity, not a recorded cash outflow.
We must also read the proportions. NC3 equals 59.3% of net stay revenue. Commercial cost represents 18.2%, while operational consumption reaches 19.7%. These relationships allow us to compare bookings of different values without losing the absolute figure. Even so, I do not recommend managing solely by percentages: one stay may show a high margin and contribute little cash, while another may operate with a lower percentage and generate a higher total contribution.
From expected P&L to closed P&L
One of the most valuable applications is to calculate the booking several times throughout its lifecycle. This allows us to observe not only the final margin, but where it diverged from what we expected.
- Expected P&L at confirmation. It uses contracted revenue, expected commercial cost, standard consumption, cancellation probability, included services and demand context. It serves pricing, acceptance and inventory allocation.
- Provisional P&L during the stay. It incorporates actual occupancy, upgrades, extras, changes, incidents and observed consumption. It can trigger relevant recovery decisions or recommendations without turning every interaction into a sale.
- Realised P&L after departure. It closes known revenue, consumption, compensation and operating costs.
- Reconciled P&L. It adds channel settlements, payment processing, refunds, fraud and adjustments that arrive after check-out.
I use a simple contribution variance:
Margin variance = realised NC3 − expected NC3
I then divide that variance by causes: price, channel, consumption, complexity, compensation, modification, additional service or allocation error. That explanation is more actionable than simply labelling the stay as profitable or unprofitable.
Close-out requires a calendar and owners
A template without a close-out process quickly becomes outdated. Revenue may be available when the guest departs, while the final commission, a card dispute or a supplier invoice may arrive days later. That is why I establish statuses and deadlines:
- T plus 1 day. Initial operational close with folio, services, incidents and compensation.
- T plus 3 days. Departmental validation of exceptional consumption, refunds and known external costs.
- T plus 10 days. Inclusion of available commercial and payment settlements.
- Subsequent close by exception. Update for a significant chargeback, claim, refund or late invoice.
Each block needs an owner. Revenue validates demand context and displacement; Marketing validates acquisition attribution; Finance validates collection and reconciliation; Operations validates consumption and exceptions; Reservations validates pre-stay complexity; and service managers validate their variable costs. Coordination does not require everyone to edit the template. It requires every definition to have an authority and disagreements to be resolved before they become KPIs.
Operational information from the stay can also provide important signals, provided it is translated into useful commitments and events. An operational CRM that coordinates the stay can record requests, changes and incidents without requiring the Finance team to reconstruct the whole history later through scattered emails and notes.
The indicators that emerge from the template
Once a consistent foundation exists, the hotel can analyse contribution from perspectives far more useful than the overall average:
- Net contribution per booking and night. This allows durations to be compared, although it should be read alongside total capacity consumption.
- Contribution by channel, rate and segment. This reveals internal differences hidden beneath overly broad labels.
- Commercial cost per euro of contribution. This measures how much acquisition effort is required to generate margin, not merely revenue.
- Variance between expected and realised margin. This indicates where the commercial model, consumption forecast or operational delivery is failing.
- Economic complexity index. This relates modifications, requests, interventions and incidents to the contribution achieved.
- Percentage of estimated contribution. This warns how much the result depends on assumptions and prevents all figures from being granted equal confidence.
- Margin concentration. This shows what proportion of contribution comes from a small number of segments, channels, dates or customers and enables dependency to be assessed.
- Contribution leakage. This adds up avoidable variances caused by errors, compensation, unfulfilled promises, incorrect distribution or unplanned consumption.
I would not turn all these indicators into individual targets. Analysis should guide decisions and learning, not create defensive behaviours. If a department is rewarded for reducing its allocated cost, the temptation will soon arise to shift work elsewhere or dispute every incident. Contribution by stay requires a cross-functional perspective because the guest consumes an entire hotel, even if the organisation chart insists on dividing it.
A gradual implementation protects credibility
I have seen analytical initiatives lose support by trying to encompass everything from day one. To avoid this, I propose five stages:
- Define the priority decision. It may be comparing channels, reviewing packages, analysing highly complex stays or measuring compensation. The first version should answer a specific economic question.
- Build a minimum viable P&L. Include net revenue, acquisition, collection, standard room cost, included services and compensation. A simple, consistent foundation is preferable to an exhaustive template full of weak estimates.
- Validate a manual sample. Select bookings that differ by channel, duration, rate and complexity. Reconstructing them with the departments makes it possible to discover exceptions and definition errors before scaling up.
- Reconcile with the aggregated result. The sum of bookings will not match the accounting statement perfectly, but the differences should be explained by fixed costs, non-attributable revenue, close-out timings and out-of-scope items.
- Turn findings into decisions. Modify a package, review a channel, change a policy, adjust a supplement, limit capacity or correct a promise. If, after several months, the template produces only reports, it is not yet integrated into hotel management.
I would start with the bookings where there is the greatest likelihood of learning: complex packages, stays involving compensation, costly channels, compressed dates, repeat guests and products with several included services. A well-chosen sample can uncover more opportunities than processing thousands of bookings using rules that no one has validated.
Nor should the template be used to classify guests as “good” or “bad” according to the margin from a single visit. A stay may be less profitable because of a breakdown, a poorly designed promise or an internal decision. The P&L evaluates the economics of a transaction and helps improve the system; it does not grant permission to reduce hospitality for those who spend less.
My final recommendation is to select twenty closed bookings and reconstruct them with a small team from Revenue, Finance and Operations. Do not look for automation or perfection yet. Compare what you believed they contributed with what they actually generated, document the differences and select the three most recurrent causes of contribution leakage. That is usually where the real work begins.
Then use that learning to change future decisions. Adjust a minimum price, redesign a package, correct a commission, limit a difficult-to-deliver service or improve the coordination generating compensation. The template becomes valuable when it changes hotel strategies, hotel strategic planning and the guest experience in hotels, not when it adds another figure to the dashboard.
A confirmed booking will always be a small promise of revenue. Only after serving it, collecting payment and closing its consequences can we know how much business it generated. If you learn to cover that distance with discipline, you will discover that hotel profitability is not decided only in the budget or the Revenue meeting. It is built stay by stay, through hundreds of decisions that can finally be made visible.
This article ends here. The archive does not.
Lead Hospitality brings together 1200 English articles published since 2018: years of experiences, decisions and lessons you can keep exploring.
What would you like to explore next?
Choose a direction and keep reading around what you want to solve, learn or challenge.